
Representation of Relief Form – SS3 Geography Lesson Note (Second Term)
Lesson note at a glance
- Class
- SS3
- Subject
- Geography
- Term
- Second Term
- Reading time
- 6 min
Relief is the variation in height and shape of the Earth’s surface, from the highest to the lowest points in an area. On maps it is shown by contour lines, form lines, hill shading, hachures, spot heights, benchmarks and trigonometrical stations.
Behavioural objectives
- Define relief and name common relief features.
- List the methods of representing relief on maps.
- Describe each method in one or two points.
- Identify slopes, hills, ridges and valleys from the pattern of contour lines.
- Distinguish between benchmarks, spot heights and trigonometrical stations.
Instructional techniques
- Identification
- Explanation
- Questions and answers
- Demonstration
- Videos from source
Instructional materials
- Videos
- Loudspeaker
- Textbook
- Pictures
- Map
What is relief?
Relief is the difference in height and shape between the highest and lowest parts of the land.
- Relief feature: any landform that makes up the surface of the land.
- Cartography: the making of maps. Relief is a basic idea in cartography because maps are flat but land is not.
What are the common relief features?
There are seven common relief features: mountain, hill, plateau, valley, plain, ridge and escarpment.
- Mountain: very high land with steep sides, such as Chappal Waddi.
- Hill: raised land lower than a mountain, with a rounded top.
- Plateau: high, flat-topped land, such as the Jos Plateau.
- Valley: low land between hills or mountains, often with a river.
- Plain: large, flat or gently sloping low land.
- Ridge: a long, narrow line of high land.
- Escarpment: a long, steep slope that separates higher land from lower land.
What are the methods of representing relief on maps?
There are seven methods of representing relief on maps: contour lines, form lines, hill shading, hachures, spot heights, benchmarks and trigonometrical stations.
- Reason: maps are flat, so symbols and numbers are used to show height and slope.
- Exact methods: contour lines, spot heights, benchmarks and trigonometrical stations give figures for height.
- Picture methods: form lines, hill shading and hachures mainly show the shape of the land.
What are contour lines?
Contour lines are lines joining places of the same height above mean sea level.
- Contour interval: the vertical difference in height between one contour and the next.
- Shape: each line closes on itself, though this may happen beyond the edge of the map.
- Crossing: contour lines do not cross each other. They join only at a cliff or overhang.
- Heights: figures are written on the lines to show their value.
- Slope: lines close together show a steep slope. Lines far apart show a gentle slope.
- Advantage: they give exact heights and show the shape of the land.
- Limit: the reader needs some skill to interpret them.

How do you read contour patterns?
Each pattern of contour lines stands for a particular feature, as shown below.
| Pattern on the map | Feature shown |
|---|---|
| Lines close together | Steep slope |
| Lines far apart | Gentle slope |
| Evenly spaced lines | Uniform slope |
| Closed rings, highest value at the centre | Hill or peak |
| V-shaped lines pointing to higher ground | Valley |
| V-shaped lines pointing to lower ground | Ridge or spur |
| Lines very close together or joined | Cliff or very steep face |
| Few widely spaced lines at a high value | Plateau top |
| Few widely spaced lines at a low value | Plain |
What are the steps for reading a contour map?
- Find the contour interval from the map key.
- Read the height figures written on the lines.
- Note where lines are close together and where they are far apart.
- Look at the shape of the lines: rings, V-shapes or straight bands.
- Name the feature using the pattern table above.
What are the types of slope on a contour map?
There are three types of slope on a contour map: uniform, concave and convex.
- Uniform slope: contour lines are evenly spaced, so the slope has the same steepness throughout.
- Concave slope: lines are close together at the top and wider apart towards the bottom, so the slope is steep above and gentle below.
- Convex slope: lines are wide apart at the top and closer together towards the bottom, so the slope is gentle above and steep below.
What are form lines?
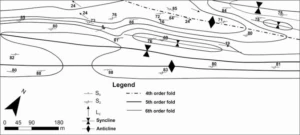
Form lines are lines drawn by estimation to show the general shape of the land.
- Accuracy: they are not based on exact survey, so they have no fixed vertical interval.
- Appearance: they are usually broken lines, to separate them from true contours.
- Use: they show hills, valleys and ridges where accurate heights are not known.
What is hill shading?
Hill shading is shading that imitates light and shadow on the land.
- Light side: slopes facing the light are left pale.
- Dark side: slopes away from the light are shaded darker. The light is usually taken from the north-west.
- Advantage: it gives a clear three-dimensional picture of the land.
- Limit: it gives no exact heights.
What are hachures?
Hachures are short lines drawn down the slope, in the direction water would flow.
- Steep slope: the lines are thick and close together.
- Gentle slope: the lines are thin and far apart.
- Limit: they show slope direction and steepness but not exact height.
What are spot heights?
A spot height is a point on the map marked with a dot and a figure for its height.
- Position: often placed on hilltops, road junctions and flat areas between contours.
- Use: they give the exact height of a particular place.
What are benchmarks?
A benchmark is a fixed mark of known height above sea level, cut on a permanent object such as a bridge, building or rock.
- Symbol: shown on the map with the letters BM and a height figure.
- Use: surveyors start height measurements from them.
What are trigonometrical stations?
A trigonometrical station is a permanent survey point fixed by triangulation, with known position and height.
- Symbol: usually a triangle with a height figure beside it.
- Position: usually on hilltops, where other stations can be seen.
- Use: they are the main control points for accurate mapping.
What is the difference between a spot height, a benchmark and a trigonometrical station?
All three give the height of one point, but they differ in symbol, position and purpose.
- Spot height: a surveyed point shown as a dot with a height figure.
- Benchmark: a mark cut on a permanent object, shown as BM with a height figure.
- Trigonometrical station: a survey control point fixed by triangulation, shown as a triangle.
| Point | Symbol | Usual position | Main use |
|---|---|---|---|
| Spot height | Dot with a figure | Hilltops, road junctions, flat areas | Gives the height of one place |
| Benchmark | BM with a figure | Bridges, buildings, rocks | Starting point for height measurement |
| Trigonometrical station | Triangle with a figure | Hilltops | Control point for accurate mapping |
How do the methods compare?
The table shows which methods give exact height and which show slope.
| Method | Gives exact height? | Shows slope? |
|---|---|---|
| Contour lines | Yes | Yes |
| Form lines | No | Yes, roughly |
| Hill shading | No | Yes, as a picture |
| Hachures | No | Yes |
| Spot heights | Yes, at one point | No |
| Benchmarks | Yes, at one point | No |
| Trigonometrical stations | Yes, at one point | No |
Evaluation
- What is relief?
- Name five relief features and describe each in one line.
- Describe five methods of representing relief features on maps.
- What do closely spaced contour lines show?
- State one difference between a benchmark and a trigonometrical station.
Assignment
- Draw a simple contour map of a hill with a steep slope on one side and a gentle slope on the other. Label the contour values and name the method used.
This term's Geography topics
SS3 Second Term · 6 topics
SS3 Geography Lesson Notes for Other Topics

GIS Application
Read the full lesson note.

Bush Fallowing in West Africa
Read the full lesson note.

Mining in Africa (Copper, Gold, and Petroleum)
Read the full lesson note.

Principle of Elementary Surveying
Read the full lesson note.
Map Readings
Read the full lesson note.
Volcanicity
Read the full lesson note.
Karst (Limestone) Topography
Read the full lesson note.

Denudational Processes
Read the full lesson note.
Weathering
Read the full lesson note.

Mass Movements
Read the full lesson note.
Climatic Change
Read the full lesson note.

ECOWAS
Read the full lesson note.

World Trade
Read the full lesson note.

Tourism
Read the full lesson note.

Satellite Remote Sensing
Read the full lesson note.
Lesson Notes for Other Classes

SS1 Lesson Note
The complete lesson note to guide your studies.

SS2 Lesson Note
The complete lesson note to guide your studies.
