
Representation of Relief Form – SS3 Geography Lesson Note (Second Term)
Download this term · ₦1,000Lesson note at a glance
- Subject
- Geography
- Class
- SS3
- Term
- Second Term
- Topic
- Representation of Relief Form
- Order
- Topic 5 of 6 this term
- Reading time
- 3 min
Relief is the variation in elevation and shape of the Earth’s surface. It is the difference between the highest and lowest points in a given area. Relief is shown on maps by contour lines, form lines, benchmarks, hill shading, hachures, spot heights and trigonometrical stations, which convey the three-dimensional shape of the terrain.
Behavioural objectives
By the end of the lesson, students should be able to:
- Identify relief features shown on maps.
- Describe the methods of representing relief features on maps.
Instructional techniques
- Identification
- Explanation
- Questions and answers
- Demonstration
- Videos from source
Instructional materials
- Videos
- Loudspeaker
- Textbook
- Pictures
- Map
What is relief?
Relief refers to the variation in elevation and shape of the Earth’s surface. It is the difference between the highest and lowest points in a given area, often depicted on maps through contour lines to represent the three-dimensional aspect of the terrain.
Relief features include mountains, valleys, hills, plateaus and other landforms that contribute to the overall topography of a region.
Relief is a fundamental concept in geography and cartography. It gives a visual representation of the physical landscape and helps in understanding the characteristics of the Earth’s surface.
What are the methods of representing relief features on maps?
Relief features on maps are represented using various methods to convey the three-dimensional aspects of the Earth’s surface. Below are some common methods.
1. Contour lines
Contour lines connect points of equal elevation on the Earth’s surface. They form closed loops and indicate the shape and steepness of the terrain.

Contour lines help visualise the elevation and relief of the landscape. The closer the lines, the steeper the slope.
2. Form lines
Similar to contour lines, form lines connect points of equal elevation. They are often used in military maps and focus on specific terrain features.
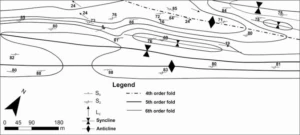
Form lines provide additional detail about the shape of the land, emphasising specific features such as hills, valleys or ridges.
3. Benchmarks
Benchmarks are fixed reference points with known elevations. They are often indicated on maps with a symbol and an elevation value.
Benchmarks serve as reference points for height measurement and keep elevation data consistent across different maps or surveys.
4. Hill shading
Hill shading simulates the effects of sunlight on the terrain to create shadows and highlights. It gives a three-dimensional appearance to the landscape. Hill shading enhances the visual representation of relief on maps and makes it easier to interpret the topography.
5. Hachures
Hachures are short, parallel lines used to indicate the direction and steepness of slopes. They are often applied on the downhill side of hills or mountains. Hachures give a visual cue about the slope direction and gradient, which helps in interpreting terrain features.
6. Spot heights
Spot heights are numerical values that indicate the elevation of specific points on the map. They are often represented by dots or symbols. Spot heights help users identify key elevation information for specific locations.
7. Trigonometrical stations
Trigonometrical stations are permanent points established with known coordinates and elevations through trigonometric measurements. They serve as reference points for mapping and surveying. They provide a stable and accurate foundation for mapping and allow precise measurements and calculations in the field.
Evaluation
- What is relief?
- Mention five relief features found on the map provided.
- Describe five methods of representing relief features on maps.
Assignment
Classwork: answer the evaluation questions above.
The teacher ends the lesson by commending the students.
This term's Geography topics
SS3 Second Term · 6 topics
Get Geography as PDF and Word
Every week of SS3 Geography, Second Term, formatted and ready to print. Ad-free, and the copy lock comes off.
Get this term Card, bank transfer, USSD or OPay
SS3 Geography Lesson Notes for Other Topics

GIS Application
Read the full lesson note.
Bush Fallowing in West Africa
Read the full lesson note.

Mining in Africa (Copper, Gold, and Petroleum)
Read the full lesson note.
Principle of Elementary Surveying
Read the full lesson note.
Map Readings
Read the full lesson note.
Volcanicity
Read the full lesson note.
Karst (Limestone) Topography
Read the full lesson note.
Denudational Processes
Read the full lesson note.
Weathering
Read the full lesson note.
Mass Movements
Read the full lesson note.
Climatic Change
Read the full lesson note.
ECOWAS
Read the full lesson note.

World Trade
Read the full lesson note.

Tourism
Read the full lesson note.

Satellite Remote Sensing
Read the full lesson note.
Lesson Notes for Other Classes

SS1 Lesson Note
The complete lesson note to guide your studies.

SS2 Lesson Note
The complete lesson note to guide your studies.
