
Graphical Presentation of Data & Frequency Distribution – SS1 Mathematics Lesson Note (Third Term)
Download this term · ₦1,000Lesson note at a glance
- Subject
- Mathematics
- Class
- SS1
- Term
- Third Term
- Topic
- Graphical Presentation of Data & Frequency Distribution
- Order
- Topic 6 of 6 this term
- Reading time
- 7 min
Graphical presentation of data is the use of diagrams to show collected data so that it can be read at a glance.
Behavioural objectives
By the end of the lesson, students should be able to:
- state what graphical presentation of data means;
- build a frequency distribution table from raw data;
- draw a bar chart from a frequency table and identify the modal item;
- calculate sectoral angles and draw a pie chart;
- draw a histogram for grouped data;
- state the differences between a bar chart and a histogram.
Why present data in graphs?
Graphs are used because they give a very clear picture of statistical data.
- Quick reading: the highest and lowest values can be seen at once.
- Easy comparison: items or classes can be compared by the size of bars or sectors.
- First step: the data is organised in a frequency distribution table before it is drawn.
What are the common types of graph for data?
There are six common types: bar chart, pie chart, histogram, frequency polygon, frequency curve and cumulative frequency curve (ogive).
- Bar chart: rectangular bars, with gaps between them, show the frequency of each item.
- Pie chart: a circle divided into sectors shows how a total is shared.
- Histogram: touching bars show the frequency of each class in grouped data.
- Frequency polygon: a line graph joins the midpoints of the tops of the histogram bars.
- Frequency curve: a smooth curve is drawn through the points of a frequency polygon.
- Ogive: a curve drawn from cumulative frequencies.
This note covers the bar chart, pie chart and histogram.
What is a frequency distribution?
A frequency distribution is a table that shows each value, or class of values, and the number of times it occurs.
- Variable: the item being counted or measured, such as a type of drink or a score.
- Frequency (f): the number of times a value occurs.
- Tally: a stroke drawn for each count, with every fifth stroke crossing the four before it.
- Total frequency (Σf): the sum of all the frequencies.
How do you make a frequency distribution table?
- List all the different values, or classes, in the first column.
- Go through the raw data and make one tally stroke for each item.
- Count the tally strokes and write the frequency for each value.
- Add the frequencies to get the total frequency and check it against the number of items.
What is grouped data?
Grouped data is data arranged in class intervals, used when there are many different values.
- Class interval: a range of values, such as 1 – 10.
- Lower and upper class limits: the smallest and largest values in a class. For 1 – 10 they are 1 and 10.
- Class boundaries: the points halfway between the upper limit of one class and the lower limit of the next. For 1 – 10 they are 0.5 and 10.5.
- Class size: upper boundary minus lower boundary. For 1 – 10 it is 10.5 – 0.5 = 10.
What is a bar chart?
A bar chart is a diagram that uses rectangular bars to represent collected data.
- Bar width: all bars have the same width.
- Bar height: the height of each bar is proportional to the frequency. The higher the frequency, the taller the bar.
- Gaps: the gaps between the bars are equal in width. They need not be the same width as the bars.
- Axes: frequencies go on the vertical axis and the variables on the horizontal axis.
- Use: a bar chart displays qualitative and discrete data.
How do you draw a bar chart?
- Draw the horizontal and vertical axes.
- Choose a suitable scale for the frequency on the vertical axis.
- Mark the variables at equal spacing along the horizontal axis.
- Draw a bar of equal width above each variable, with its height equal to the frequency.
- Label both axes and give the chart a title.
Example: bar chart
The table below shows the number of bottles of soft drinks sold in GODSHEPHRD restaurant on a Thursday. Draw a bar chart to display the information and state the modal drink.
| Types of soft drinks | Number of bottles |
|---|---|
| Coke | 12 |
| Fanta | 10 |
| Sprite | 6 |
| Lemon | 2 |
| Pepsi | 8 |
| Viju Milk | 8 |
| Caprison | 4 |
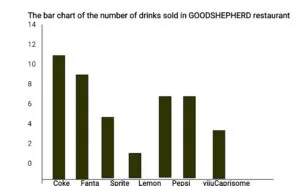
- Modal drink: the tallest bar is Coke, with a frequency of 12. Hence the modal drink is Coke.
- Total sold: 12 + 10 + 6 + 2 + 8 + 8 + 4 = 50 bottles.
What are the other forms of bar chart?
Two other forms are the compound bar chart and the composite bar chart.
- Compound bar chart: used to compare two or more sets of information, with their bars drawn side by side.
- Composite bar chart: each bar is divided into parts to show the components that make up the total.
What is a pie chart?
A pie chart, also called a divided circle, is a circle divided into sectors, with each sectoral angle proportional to the frequency.
- Sector: the part of the circle between two radii.
- Sectoral angle: the angle at the centre of a sector. All the angles add up to 360°.
- Size rule: the higher the frequency, the larger the sectoral angle and the larger the sector.
What is the formula for the sectoral angle?
Sectoral angle = (frequency ÷ sum of frequencies) × 360°
How do you draw a pie chart?
- Make a frequency table showing the variables and the frequencies.
- Add the frequencies to get the total.
- Work out each sectoral angle with the formula and add a column for it.
- Check that the angles add up to 360°.
- Draw a circle with a pair of compasses and mark its centre.
- Draw a radius, then measure each angle in turn with a protractor.
- Label each sector with its variable or angle.
- Tools: use a pair of compasses and a protractor.
- No free-hand sketch: each sector stands for a particular angle, so the angle must be measured accurately.
Example: pie chart
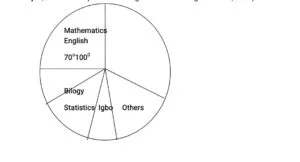
In a certain school, the lesson periods for each week are as follows: English 10; Mathematics 7; Biology 3; Statistics 4; Igbo 3; Others 9. Draw a pie chart to illustrate the information.
Solution
- Construct a simple frequency table, as shown below. The total frequency is 10 + 7 + 3 + 4 + 3 + 9 = 36.
| Subjects | Number of periods (F) | Sectoral angles (degrees) |
|---|---|---|
| English | 10 | 10/36 × 360° = 100° |
| Mathematics | 7 | 7/36 × 360° = 70° |
| Biology | 3 | 3/36 × 360° = 30° |
| Statistics | 4 | 4/36 × 360° = 40° |
| Igbo | 3 | 3/36 × 360° = 30° |
| Others | 9 | 9/36 × 360° = 90° |
- Check the angles: 100° + 70° + 30° + 40° + 30° + 90° = 360°.
- Construct a pie chart using the sectoral angles above, with a protractor.
What is a histogram?
A histogram is a statistical diagram that uses rectangular bars to represent grouped data.
- Bar width: the bars have the same width when the class intervals are equal.
- Bar height: the height of each bar is proportional to the frequency.
- No gaps: unlike the bars of a bar chart, the bars of a histogram touch each other.
- Horizontal axis: it shows the class intervals, drawn from the class boundaries.
- Use: a histogram is mostly used for grouped data.
How do you draw a histogram?
- Find the class boundaries of each class.
- Draw the axes and mark the class boundaries along the horizontal axis.
- Choose a suitable scale for the frequency on the vertical axis.
- Draw a bar over each class, with height equal to its frequency, and no gaps between bars.
- Label both axes and give the histogram a title.
Example: histogram
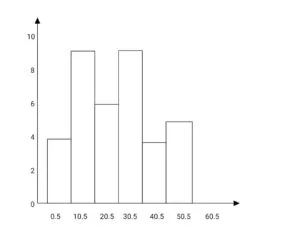
Construct a histogram for the distribution below.
| Class interval | 1 – 10 | 11 – 20 | 21 – 30 | 31 – 40 | 41 – 50 | 51 – 60 |
| Frequency | 3 | 9 | 6 | 9 | 3 | 5 |
- Class boundaries: 0.5 – 10.5, 10.5 – 20.5, 20.5 – 30.5, 30.5 – 40.5, 40.5 – 50.5, 50.5 – 60.5.
- Class size: 10 for every class, so all the bars have equal width.
- Total frequency: 3 + 9 + 6 + 9 + 3 + 5 = 35.
What is the difference between a bar chart and a histogram?
A bar chart shows separate items with spaced bars, while a histogram shows grouped data with touching bars.
| Feature | Bar chart | Histogram |
|---|---|---|
| Gaps between bars | Equal gaps between the bars | No gaps, the bars touch |
| Type of data | Qualitative and discrete data | Grouped data |
| Horizontal axis | Separate items or variables | Class intervals, drawn from class boundaries |
| Order of bars | Bars can be rearranged | Bars follow the order of the classes |
| Bar width | Same for all bars | Same for all bars when class intervals are equal |
Evaluation
The table gives the number of hours per week allotted to each subject taught at a technical school.
| Subject | Maths | Technical Drawing | Woodwork | Mechanics | Science | Metalwork |
| Hours per week | 5 | 4 | 2 | 3 | 4 | 3 |
- Represent the information on a pie chart.
- Draw a bar chart to show the information.
- State the formula for finding a sectoral angle.
- State two differences between a bar chart and a histogram.
Assignment
Forty SS1 students were asked for their favourite food: Rice 15, Beans 10, Yam 8, Garri 4, Bread 3. Calculate the sectoral angle for each food, draw a pie chart, and state the modal food.
This term's Mathematics topics
SS1 Third Term · 6 topics
- Mensuration: Circle and It’s Properties
- Area of Sector and Segment
- Surface Area and Volume of Solid Shapes
- Area and Volume of Frustum
- Collection, Tabulation & Presentation of Grouped Data
- Graphical Presentation of Data & Frequency Distribution
Get Mathematics as PDF and Word
Every week of SS1 Mathematics, Third Term, formatted and ready to print. Ad-free, and the copy lock comes off.
Get this term Card, bank transfer, USSD or OPay
SS1 Mathematics Lesson Notes for Other Topics

Mensuration: Circle and It's Properties
Read the full lesson note.

Area Of Sector And Segment
Read the full lesson note.

Surface Area And Volume Of Solid Shapes
Read the full lesson note.

Area And Volume Of Frustum
Read the full lesson note.
Collection, Tabulation & Presentation of Grouped Data
Read the full lesson note.
Number Base System
Read the full lesson note.
Modular Arithmetic
Read the full lesson note.

Indices
Read the full lesson note.

Logarithm
Read the full lesson note.
Quadratic Equations
Read the full lesson note.
Formation Of Quadratic Equations With Given Roots
Read the full lesson note.

Logical Reasoning
Read the full lesson note.

Logarithm
Read the full lesson note.

Logarithm II
Read the full lesson note.
Sequence And Series - Arithmetic Progression
Read the full lesson note.
Lesson Notes for Other Classes

SS2 Lesson Note
The complete lesson note to guide your studies.

SS3 Lesson Note
The complete lesson note to guide your studies.
