
Statistics: Data Representation (Bar Chart and Pie Charts) – JSS2 Mathematics Lesson Note (Third Term)
Lesson note at a glance
- Class
- JSS2
- Subject
- Mathematics
- Term
- Third Term
- Reading time
- 6 min
Data representation is the showing of collected figures in a form that is easy to read, using tables, charts and graphs.
Behavioural objectives
By the end of the lesson, students should be able to:
- prepare a frequency table from raw data using tally marks;
- calculate the mean, median and mode of a set of data;
- describe and draw a bar chart;
- calculate the percentage and the angle of each sector of a pie chart;
- state what a line graph is used for.
What is a frequency table?
A frequency table lists each value in a set of data, a tally of how many times it occurs, and the frequency (the total of the tally).
- Raw data: figures as first collected, in no particular order.
- Tally mark: a short stroke (|) made for each time a value occurs.
- Group of five: four strokes crossed by a fifth, written here as ||||/ so that counting is quick.
- Frequency: the number of times a value occurs, found by counting the tally.
How do you prepare a frequency table?
- List every different value in the first column, in order of size.
- Go through the raw data one figure at a time and make one stroke in the tally column for each.
- Count the strokes for each value and write the frequency.
- Add up the frequencies and check that the total equals the number of figures in the data.
Example 1
The following figures show the number of children per family in a sample of households: 1, 2, 4, 3, 5, 3, 8, 3, 2, 3, 4, 5, 6, 5, 4, 2, 1, 3, 2, 4, 5, 3, 8, 7, 6, 5, 4, 5, 7, 6, 3, 8, 6, 3, 5, 7, 5, 4, 3.
- Use tally marks to prepare a frequency table for the data.
- What is the highest frequency of the number of children per family?
Solution
| Number | Tally | Frequency |
|---|---|---|
| 1 | || | 2 |
| 2 | |||| | 4 |
| 3 | ||||/ |||| | 9 |
| 4 | ||||/ | | 6 |
| 5 | ||||/ ||| | 8 |
| 6 | |||| | 4 |
| 7 | ||| | 3 |
| 8 | ||| | 3 |
| Total | 39 |
- Answer (b): the highest frequency is 9, for families with 3 children.
Example 2
In a further mathematics test, the following marks were obtained by a group of students: 85, 75, 95, 80, 75, 80, 90, 84, 95, 84, 85, 80, 80, 75, 80, 75, 80, 84, 81, 80, 75, 90, 80.
Use tally marks to prepare a frequency table for this data.
Solution
| Mark | Tally | Frequency |
|---|---|---|
| 75 | ||||/ | 5 |
| 80 | ||||/ ||| | 8 |
| 81 | | | 1 |
| 84 | ||| | 3 |
| 85 | || | 2 |
| 90 | || | 2 |
| 95 | || | 2 |
| Total | 23 |
- How many students took part in the test? 23 students.
- Which mark had the highest frequency? 80, which occurs 8 times.
What are the average, mean, median and mode?
The average is a single value used to represent a set of numbers, and it is the most commonly used statistic.
- Mean: the sum of all the values divided by the number of values. The mean is also called the average.
- Median: the number in the middle after the data have been arranged in order.
- Mode: the value that occurs most frequently.
How do you find each one?
- Mean: add all the values, then divide the sum by how many values there are.
- Median, odd number of values: arrange in order and take the middle value.
- Median, even number of values: arrange in order and take the mean of the two middle values.
- Mode: count how often each value occurs and pick the one with the highest count.
- Two modes: if two values tie for the highest count, both are modes.
- No mode: if every value occurs once, the data has no mode.
Example
Calculate the mean, median and mode of the following data.
- 45, 50, 55, 54, 48, 53, 50, 55
- 38, 35, 36, 30.8, 34.7, 37.9, 33.1
- 3, 0, 4, 7, 0, 5, 3, 4, 0, 3, 6, 5, 5, 4, 6, 5
Solution (a)
- Mean: (45 + 50 + 55 + 54 + 48 + 53 + 50 + 55) ÷ 8 = 410 ÷ 8 = 51.25.
- Arrange in order: 45, 48, 50, 50, 53, 54, 55, 55.
- Median: there are 8 values, so the two middle numbers are 50 and 53. Median = (50 + 53) ÷ 2 = 51.5.
- Mode: 50 and 55 each occur twice, so the mode is 50 and 55.
What is a bar chart?
A bar chart is a series of rectangular bars of the same width, drawn vertically or horizontally, with an equal space between them.
- Height or length: the height (or length) of each bar shows the size of the data it represents.
- Vertical bar chart: bars stand upright from a horizontal base line.
- Horizontal bar chart: bars lie sideways from a vertical base line.
How do you draw a bar chart?
- Draw a horizontal axis and a vertical axis.
- Choose a suitable scale for the axis that shows the amounts, starting from 0.
- Label each bar on the other axis with the item it represents.
- Draw each bar to its correct height, with the same width and equal gaps.
- Give the chart a title and label both axes.
Example
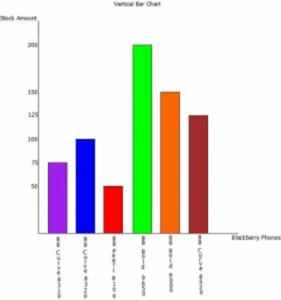
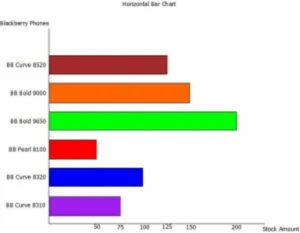
The table below lists several models of Blackberry cellular phones and the number of each that an electronic store has in stock. Draw a vertical and a horizontal bar chart to represent the data.
| Blackberry phones stock | Amount |
|---|---|
| Blackberry Curve 8310 | 75 |
| Blackberry Curve 8320 | 100 |
| Blackberry Pearl 8100 | 50 |
| Blackberry Bold 9650 | 200 |
| Blackberry Bold 9000 | 150 |
| Blackberry Curve 8520 | 125 |
What is a pie chart?
A pie chart is a circular diagram divided into sectors, where the size of each sector shows the size of the data it represents.
- Sector: one slice of the circle.
- Percentage form: all the sectors must add up to 100%.
- Angle form: all the sectors must add up to 360°, the angle at the centre of the circle.
How do you draw a pie chart?
- Add up all the values to get the total.
- Calculate the percentage or the angle of each sector using the formulas below.
- Check that the percentages add up to 100% or the angles add up to 360°.
- Draw a circle and mark its centre.
- Use a protractor to measure and draw each sector, one after the other.
- Label each sector and give the chart a title.
Example
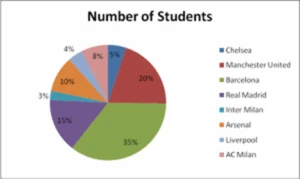
The table below lists some of the most popular football clubs and the number of students at a given institution who support each. Use a pie chart to represent the information in the table.
| Football club | Number of students |
|---|---|
| Chelsea | 50 |
| Manchester United | 200 |
| Barcelona | 350 |
| Real Madrid | 150 |
| Inter Milan | 25 |
| Arsenal | 100 |
| Liverpool | 40 |
| AC Milan | 75 |
How do you calculate the percentage of a sector?
The pie chart above shows each sector as a percentage.
- Total: 50 + 200 + 350 + 150 + 25 + 100 + 40 + 75 = 990 students.
- Formula: % of a sector = (Number of students ÷ Total number of students) × 100.
- Chelsea: (50 ÷ 990) × 100 = 5.05%, which is 5% to the nearest whole number.
How do you calculate the angle of a sector?
For a pie chart that shows each sector as an angle, multiply the fraction by 360° instead of 100.
- Formula: Angle of a sector = (Number of students ÷ Total number of students) × 360°.
- Chelsea: (50 ÷ 990) × 360° = 18.18°, which is 18° to the nearest degree.
Note: In most cases, questions on pie charts require the sectors to be shown as percentages.
What is a line graph?
A line graph is a graph that joins plotted points with straight lines, and it is mostly used to show trends.
- Use: values are usually plotted against time, such as years or months.
- Trend: a rising line shows an increase and a falling line shows a decrease.
How do you draw a line graph?
- Draw the axes. Put time on the horizontal axis and the values on the vertical axis.
- Choose a suitable scale for each axis.
- Mark a point for each value.
- Join consecutive points with straight lines.
- Give the graph a title and label both axes.
Example
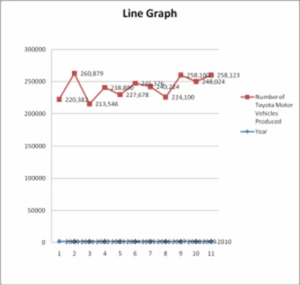
The table below lists the number of Toyota motor vehicles produced in April over the period 2000 to 2010.
| Year | Number of Toyota motor vehicles produced |
|---|---|
| 2000 | 220,382 |
| 2001 | 260,879 |
| 2002 | 213,546 |
| 2003 | 238,890 |
| 2004 | 227,678 |
| 2005 | 245,376 |
| 2006 | 240,224 |
| 2007 | 224,100 |
| 2008 | 258,100 |
| 2009 | 248,024 |
| 2010 | 249,123 |
Evaluation
- State what is meant by the mean, the median and the mode of a set of data.
- In what two ways can the sectors of a pie chart be shown? What must the sectors add up to in each case?
- Using the football table, calculate the percentage of students who support Manchester United.
- Describe a bar chart.
- What are line graphs mostly used for?
Assignment
- Calculate the mean, median and mode of the data in examples (b) and (c) under “What are the average, mean, median and mode?”.
- Using the football table, calculate the angle of the Barcelona sector of a pie chart.
This term's Mathematics topics
JSS2 Third Term · 5 topics
- Angles and Polygons
- Angles of Elevation and Depression
- Bearing and Distances
- Statistics: Data Representation (Bar Chart and Pie Charts)
- Probability
JSS2 Mathematics Lesson Notes for Other Topics

Angles And Polygons
Read the full lesson note.
Angles of Elevation And Depression
Read the full lesson note.

Bearing and Distances
Read the full lesson note.

Probability
Read the full lesson note.

Highest Common Factor (HCF) And Lowest Common Factor (LCF)
Read the full lesson note.

Whole Numbers, Common Multiples & Prime Factor
Read the full lesson note.

Fractions, Decimals And Percentages
Read the full lesson note.

Approximation To Significant Figures & Decimal Places
Read the full lesson note.

Multlipication And Division of Directed Number
Read the full lesson note.

Factorization And Algebraic Expressions
Read the full lesson note.

Multlipication And Division of Algebraic Fractions
Read the full lesson note.
Word Problem And Solving Inequalities
Read the full lesson note.

Linear Inequalities
Read the full lesson note.
Graphs: Graph of linear Equation
Read the full lesson note.

Plane Shapes
Read the full lesson note.
Lesson Notes for Other Classes

JSS1 Lesson Note
The complete lesson note to guide your studies.

JSS3 Lesson Note
The complete lesson note to guide your studies.
