
Basic Tools of Economic Analysis – SS1 Economics Lesson Note (First Term)
Download this term · ₦1,000Lesson note at a glance
- Subject
- Economics
- Class
- SS1
- Term
- First Term
- Topic
- Basic Tools of Economic Analysis
- Order
- Topic 3 of 10 this term
- Reading time
- 6 min
The basic tools of economic analysis are tables, graphs and charts. Economists use them to present, read and compare data so that relationships between variables are easy to see.
Behavioural objectives
- Define a table, a graph and a chart.
- State the features of a table and of a graph.
- State the uses or importance of a table and of a graph.
- Name the types of bar chart and say what each is used for.
- Describe how a pie chart is drawn.
What are the tools of economic analysis?
There are three basic tools of economic analysis: the table, the graph and the chart.
- Table: data arranged in rows and columns.
- Graph: a diagram showing how two variables are related.
- Chart: data shown as a diagram or picture, such as a bar chart or pie chart.
| Tool | Meaning | Main use |
|---|---|---|
| Table | Data arranged in rows and columns. | Shows facts and figures in an orderly way. |
| Graph | A diagram showing the relationship between two variables. | Shows how one variable changes with another. |
| Chart | Data shown as a diagram or picture, such as a bar chart or pie chart. | Compares quantities and shows shares of a total. |
Key terms
- Variable: a quantity that can change, such as price, income or quantity demanded.
- Data: facts and figures collected for study.
What is a table?
A table is a systematic and orderly arrangement of information, facts or data in rows and columns.
- Purpose: it makes the relationship between variables easier to understand.
- Common use: it is the most commonly used tool of economic analysis.
- Rows: run across the table from left to right.
- Columns: run down the table from top to bottom.
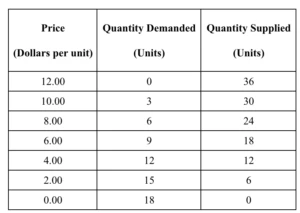
What is a simple example of a table?
The table below shows the quantity of rice demanded at different prices (illustrative figures).
| Price per bag of rice (N) | Quantity demanded (bags) |
|---|---|
| 100 | 40 |
| 200 | 30 |
| 300 | 20 |
| 400 | 10 |
- Reading the table: as price rises, the quantity demanded falls.
What are the features of a table?
A good table is orderly, titled, simple and clear about its units.
- It must give an orderly arrangement of data.
- It must have a title or heading.
- It must be numbered if there are many tables.
- It must be very simple and easy to understand.
- The units of measurement used in the table must be stated.
What are the uses or importance of a table?
A table presents data in a short, clear form that is easy to read and compare.
- It reveals information at a glance.
- It avoids repetition.
- It makes data easy to understand.
- It allows easy interpretation of data.
- It eases comparison between classes of data.
What is a graph?
A graph is a diagram showing a functional relationship between two variables.
- Link to tables: information in a table can be changed into a graph for better understanding.
- Types: many types of graph are used, depending on the nature of the data and the purpose.
- Examples in economics: the demand curve and the supply curve.
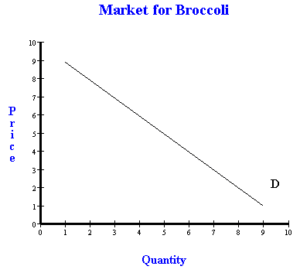
What are the axes of a graph?
The axes are the two lines, one horizontal and one vertical, on which a graph is drawn.
- x-axis: the horizontal line, drawn across the page.
- y-axis: the vertical line, drawn up the page.
- Different variables: each axis carries a different variable.
- Origin: the point where the two axes meet.
How do you draw a graph from a table?
You draw a graph from a table by plotting each pair of values as a point and joining the points.
- Draw the x-axis and the y-axis at right angles.
- Write the variable and its unit on each axis.
- Choose a suitable scale for each axis.
- Plot each pair of values from the table as a point.
- Join the points with a line or a smooth curve.
- Give the graph a title and show the source of the data.
What are the features of a graph?
A good graph has a title, suitable scales, labelled axes and a stated source.
- It must be titled.
- It must have appropriate scales.
- The y-axis and x-axis must carry different variables.
- It must show the source of the data presented.
- The y-axis must be on the vertical side and the x-axis on the horizontal side.
- It must be well labelled for better understanding.
What is the importance of a graph?
A graph turns the figures in a table into a picture that is quicker to read.
- It shows the relationship between two variables.
- It gives the quantitative information in a table a clearer and quicker impression.
- It helps to interpret the values of variables.
- The values in a table are better understood and appreciated in a graph.
- It provides a basis for comparing the variables given in a table.
What are charts?
A chart is a device used to present or interpret data as a diagram or picture.
- Bar chart: shows values as evenly spaced bars.
- Pie chart: shows shares of a total as sections of a circle.
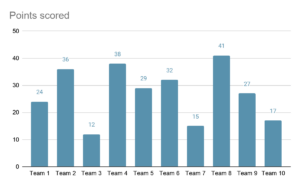
What is a bar chart?
A bar chart is a way of representing tabulated data with evenly spaced bars.
- Bars: they have equal widths and equal gaps between them.
- Height or length: each bar’s size shows the value it stands for.
What are the types of bar chart?
There are three types of bar chart: simple, component and multiple.
- Simple bar chart: has one bar for each item and is used for data with one variable.
- Component bar chart: divides each bar into parts that make up a total.
- Multiple bar chart: places bars of different variables side by side in groups.
| Type | What it shows | Used for |
|---|---|---|
| Simple bar chart | One bar for each item. | Data with one variable. |
| Component bar chart | Each bar is divided into parts that make up a total. | Showing the parts of each total. |
| Multiple bar chart | Bars of different variables placed side by side in groups. | Comparing two or more variables. |
What is a pie chart?
A pie chart is a circle divided into sections expressed in degrees.
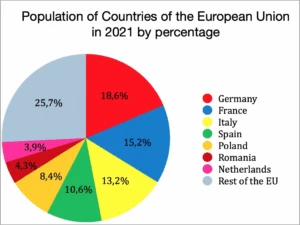
- Sections: each section is proportionate to the frequency or attribute it stands for.
- The circle: it represents the total data, which is 360 degrees.
- Instruments: it is drawn with a compass and a protractor.
How do you draw a pie chart?
You draw a pie chart by changing each item into an angle out of 360 degrees.
- Add up all the items to get the total.
- Divide each item by the total.
- Multiply the result by 360 to get the angle in degrees.
- Draw a circle with a compass and mark its centre.
- Draw one straight line from the centre to the edge.
- Use the protractor to measure each angle in turn around the centre.
- Label each section and give the chart a title.
What is a worked example of a pie chart?
A family spends N100,000 in a month, and the table gives the angle for each item (illustrative figures).
| Item | Amount (N) | Working | Angle |
|---|---|---|---|
| Food | 40,000 | 40,000 / 100,000 × 360 | 144 degrees |
| Rent | 25,000 | 25,000 / 100,000 × 360 | 90 degrees |
| Education | 20,000 | 20,000 / 100,000 × 360 | 72 degrees |
| Transport | 15,000 | 15,000 / 100,000 × 360 | 54 degrees |
| Total | 100,000 | 360 degrees |
Evaluation
- Define a table and state three of its features.
- What is a graph? State the position of the x-axis and the y-axis.
- List three uses of a table.
- Name the three types of bar chart.
- Which instruments are used to draw a pie chart?
Assignment
Write short notes on the graph as a tool of economic analysis. State five features of a graph and explain how a graph helps in understanding the information in a table.
This term's Economics topics
SS1 First Term · 10 topics
Get Economics as PDF and Word
Every week of SS1 Economics, First Term, formatted and ready to print. Ad-free, and the copy lock comes off.
Get this term Card, bank transfer, USSD or OPay
SS1 Economics Lesson Notes for Other Topics

Meaning Of Economic Concepts
Read the full lesson note.

Meaning Of Economic Concepts II
Read the full lesson note.

Basic Tools Of Economic Analysis II
Read the full lesson note.

Concept Of Demand And Supply
Read the full lesson note.

Concept Of Demand And Supply II
Read the full lesson note.

Theory of Production
Read the full lesson note.

Theory Of Production II
Read the full lesson note.

Division Of Labour And Specialization
Read the full lesson note.

Scale Of Production
Read the full lesson note.

Basic Economics Problems of Every Society
Read the full lesson note.

Firms And Industry
Read the full lesson note.

Population I: Factors Affecting Population Growth
Read the full lesson note.

Theory Of Population
Read the full lesson note.

Population Distribution
Read the full lesson note.

Labour Market
Read the full lesson note.
Lesson Notes for Other Classes

SS2 Lesson Note
The complete lesson note to guide your studies.

SS3 Lesson Note
The complete lesson note to guide your studies.
