Everyday Statistics Basic 4 Mathematics Lesson Note
Download Lesson NoteTopic: Everyday Statistics
LEARNING AREA
- Introduction
- Data Collection and Presentation
- Range and Measures of Central Tendency
- Probability
- Lesson Evaluation and Weekly Assessment (Test)
LEARNING OBJECTIVES
By the end of the lesson, most pupils should have attained the following objectives –
- interpret pictograms and bar graphs.
- use pictograms and bar graphs in representing population of people or data.
- read tally marks and frequency tables.
- interpret and draw pie charts.
- calculate range and measures of central tendency.
ENTRY BEHAVIOUR
The pupils can count and compare the number of boys and girls in the class.
INSTRUCTIONAL MATERIALS
The teacher will teach the lesson with the aid of:
- class population.
- chart showing frequency tables, pictogram, pie chart and bar chart.
- Graph sheet of papers
METHOD OF TEACHING
Choose a suitable and appropriate methods for the lessons.
Note – Irrespective of choosing methods of teaching, always introduce an activities that will arouse pupil’s interest or lead them to the lessons.
REFERENCE MATERIALS
- Scheme of Work
- 9 – Years Basic Education Curriculum
- Course Book
- All Relevant Material
- Online Information
CONTENT OF THE LESSON
LESSON 1 – INTRODUCTION
ACTIVITY 1 – DATA COLLECTION AND PRESENTATION (5 minutes)
Teacher organizes pupils in groups or pairs depending on the size of the class and leads them to,
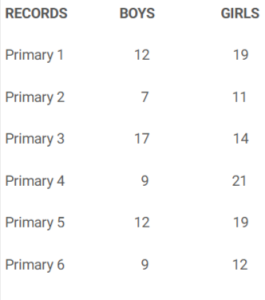
- count and record the number of boys and girls in the school.
- present the data collected in a simple table and chart.
MEANING OF DATA COLLECTION
Data collection is the gathering of facts and figures needed for the research purposes.
MEANING DATA PRESENTATION
Data presentation is the process of using different graphical formats to represent the relationship between two or more data to important decisions.
ACTIVITY 2 – TALLY AND FREQUENCY TABLE (5 minutes)

Note – / = 1, IIII = 5
ACTIVITY 4 – PICTOGRAM AND BAR CHART (5 minutes)
A pictogram is a chart or graph that represents data with pictures.
For example,
COLOURS
RED ❤️❤️❤️❤️❤️❤️❤️
GREEN 💚💚💚💚💚
YELLOW 💛💛💛💛💛💛💛💛💛
BLUE 💙💙💙💙💙💙💙💙
KEY – ❤️ = 1 💚 = 2 💛 = 1 💙 = 1
- How many red colours?
- How many yellow colours?
- How many blue colours?
- How many green colours?
- What the sum of all the colours?
WORKING
Given: ❤️ = 1 💚 = 2 💛 = 1 💙 = 1
- Red colour is 7.
- Yellow colour is 9.
- Blue colour is 8.
- Green colour is 10.
- Total colour is 7 + 9 + 8 + 10 = 34
ACTIVITY 5 – BAR CHART
A bar chart is a graph that represents data using rectangular bars.
For example,
FAVOURITE COLOURS
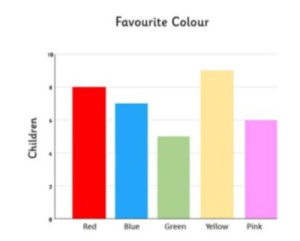
- How many red colours?
- How many yellow colours?
- How many blue colours?
- How many green colours?
- How many pink colours?
- What is the sum of all the colours?
WORKING
- Red colour is 8.
- Yellow colour is 7.
- Blue colour is 5.
- Green colour is 9.
- Pink colour is 6.
- 8 + 7 + 5 + 9 + 6 = 35
WORKING EXERCISE
- Number of Children Absent in School
Monday 🟡 🟡 🟡 🟡
Tuesday 🟡 🟡 🟡 🟡 🟡 🟡 🟡
Wednesday 🟡 🟡 🟡 🟡 🟡 🟡
Thursday 🟡 🟡 🟡 🟡 🟡 🟡 🟡 🟡 🟡 🟡 🟡 🟡
Friday 🟡 🟡 🟡 🟡 🟡 🟡 🟡 🟡 🟡 🟡
KEY – 🟡 = 2 children
- Which day has the least of children that were absent?
- Which day has the least of children that were absent?
- What is the title of the graph?
- How many children were absent on Thursday?
- Which day has the least of children that were absent?
- Which day has the most of children that were absent?
- What total number of children absent for the week?
- Mode of Transportation

- What type of chart is this?
- What is the least mode of transportation?
- What is the most mode of transportation?
- What is the total mode of transportation?
- What is the difference between most and least mode of transportation?
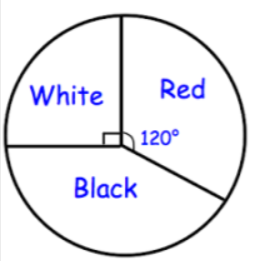
ACTIVITY 2 – INTERPRETATION OF PIE CHART

LESSON 3 – RANGE AND MEASURES OF CENTRAL TENDENCY
ACTIVITY 1 – RANGE
Range is the difference between the largest and smallest data in a given set.
For example,
The number of children in all classes are as:
Primary 1 – 26 Primary 2 – 18 Primary 3 – 31 Primary 4 – 30 Primary 5 – 26 Primary 6 – 21
The range is the highest class – the lowest class.
That’s,
Range = 31 – 18 = 13 children
WORKING EXAMPLE 2
Use the above chart to find the range of the mode of transportation.
The most mode of transportation is 35, while the least mode of transportation is 3.
Range is the different between 35 and 3.
That’s,
Range, 35 – 3 = 32
WORKING EXAMPLE 3
The ages of 10 children in a class are as follows:
11 years, 14 years, 8 years, 12 years, 14 years, 20 years, 15 years, 9 years, 16 years and 10 years.
The highest is 20 years.
The lowest is 8 years.
Range,
= 20 years – 8 years
= 12 years
ACTIVITY 3 – MEASURES OF CENTRAL TENDENCY
There are three (3) main measures of central tendency.
- Mode
- Median
- Mean
Measures of central tendency are used to describe or summarize a set of data within a given set.
ACTIVITY 4 – MODE
The mode is the most common number within a given set of data.
Of the number that appears most.
For example,
Find the mode of 4 6 8 3 7 7 1 9 4 5 6 4 3 7 8 9 10
4 = 3 times 6 = 2 times 7 = 3 times 8 = 2 times 9 = 2 times
Since 4 appears 3 times
Therefore, the mode is 4.
ACTIVITY 5 – MEDIAN
Median is the middle value in a set arranged from smallest to largest.
Median can be odd value or even value.
- FINDING MEDIAN WITH AN ODD VALUE
Find the median of the following set:
3 4 9 7 7 5 3 8 1 5 6 4 9 8 7
Step 1 – Write the numbers in order either ascending or descending
1 2 3 4 4 5 5 6 7 7 7 8 8 9 9
Step 2 – Find the middle number
The median of data set is 7.
- FINDING MEDIAN WITH AN EVEN VALUE
Find the median of the following set:
4 3 7 10 12 9 8 3 2 5 1 5 6 6 11 3
Step 1 – Write the numbers in order either ascending or descending
1 2 3 3 3 4 5 5 6 6 7 8 9 10 11 12
Step 2 – Find the middle number
The middle numbers are 8 and 6.
Step 3 – Add the two medians and divide by 2 so the middle numbers are even numbers.
That’s,
5 + 6
─────
2
= 11/2
= 5.5
The median of data set is 7.
WORKING EXERCISE (ASSIGNMENT)
Find the range, mode and median of the following
- 5, 7, 11, 2, 3, 4, 9, 1, 6, 8, 5
LESSON 4 – MEAN
ACTIVITY 1 – INTRODUCTION
Mean is the average or mean common value used of the smallest measure of tendency.
Mean is an average.
An average is the sum of the data divided by the number of data count in a set.
Mean is the average of the given numbers which is calculated by dividing the sum of given numbers by the total number of numbers.
For example,
Find the mean of the following
2, 4, 6, 8, 10 and 12
Step 1 – Add the set number together
2 + 4 + 6 + 8 + 10 + 12 = 42
Step 2 – Divide by the number of data
42/6 = 7
The mean is 7.
WORKING EXAMPLE 2
The marks of 10 pupils in a class are 85, 25, 45, 65, 85, 87, 55, 85, 94, 74, 75, 95, 55, 86, 55, 89, 67, 75, and 95.
Find the range, mode, median, and mean of the scores.
SOLUTION
- Range = Highest score – lowest score
= 95 – 25
= 70
- Mode
85, 25, 45, 65, 85, 87, 55, 85, 94, 74, 75, 95, 55, 86, 55, 89, 67, 75, 95
55 appeared 3 times
Therefore, the mode of the mark is 55.
- Median
25, 45, 55, 55, 55, 65, 67, 74, 75, 75, 85, 85, 85, 86, 87, 89, 94, 95, 95
Therefore,
85 + 85 = 170
170/2 = 85
The median mark is 85.5
- Mean
25 + 45 + 55 + 55 + 55 + 65 + 67 + 74 + 75 + 75 + 85 + 85 + 85 + 86 + 87 + 89 + 94 + 95 + 95
= 1442
= 1442/19
= 75.9
The mean of the mark is 75.9
LESSON 5 – REVISION AND WEEKLY ASSESSMENT
Find the performance difference between the lesson objectives.
PRESENTATION
To deliver the lesson, the teacher adopts the following steps:
- To introduce the lesson, the teacher revises the previous lesson. Based on this, he/she asks the pupils some questions;
- Teacher organizes the pupils in groups or pair depending on the size of the class.
- Teacher leads the groups or pairs of collect the number of boys and girls in all the classes.
Pupil’s Activities – As groups or pairs, take record of boys and girls in all the classes.
- Teacher guides pupils to represent the data collected on a simple tally table and chart.
Pupil’s Activities – Represent data on a simple tally table and chart.
- Teacher appreciates the individual’s and groups or pairs active participation and uses the their activities to introduce the lesson.
Pupil’s Activities – Pay attention to the lesson introduction to understand the concept of the lesson.
- Teacher displays pictogram and bar chart for the pupils to examine as groups or pairs.
- Teacher leads pupils to analyze and interpret the data on the pictogram and bar chart.
- Teacher guides pupils to correctly represent data on pictogram and chart chart.
Pupil’s Activities – Analyze, interpret and represent data on pictogram and chart chart.
- Teacher guides to interpret and draw a pie chart.
- Teacher leads pupils to solve questions on pie chart.
Pupil’s Activities – Solve questions on pie chart.
- Teacher leads a discussion on measures of central tendency.
- Teacher guides pupils to find range, mode, median and calculate mean of a given data.
Pupil’s Activities – Describe the range and measures of central tendency and solve related questions.
- Teacher summarizes the lesson on the board with appropriate evaluation.
Pupil’s Activities – Participate actively in the summary of the lesson and write as instructed.
CONCLUSION
To conclude the lesson for the week, the teacher revises the entire lesson and links it to the following week’s lesson.
NEXT LESSON
LESSON EVALUATION
As stated the lessons.
Third Term Mathematics Lesson Notes for Other Topics
Squares And Rectangles
Explore lesson notes covering all topics.

Time
Explore lesson notes covering all topics.

Weight
Explore lesson notes covering all topics.

Capacity
Explore lesson notes covering all topics.

Line Of Symmetry
Explore lesson notes covering all topics.

Everyday Statistics
Explore lesson notes covering all topics.

Length: Measurement in Centimetre & Metres
Explore lesson notes covering all topics.

Perimeter of Rectangle, Square & Triangles
Explore lesson notes covering all topics.
Data Collection
Explore lesson notes covering all topics.
Three-Dimensional Shapes
Explore lesson notes covering all topics.

Money
Explore lesson notes covering all topics.
Capacity
Explore lesson notes covering all topics.
Weight
Explore lesson notes covering all topics.
Length Measurement
Explore lesson notes covering all topics.

Area
Explore lesson notes covering all topics.

Lesson Notes for Other Classes

Basic 2 Lesson Note
The complete lesson note to guide your studies.
Basic 3 Lesson Note
The complete lesson note to guide your studies.

Basic 5 Lesson Note
The complete lesson note to guide your studies.
JSS1 Lesson Note
The complete lesson note to guide your studies.

JSS2 Lesson Note
The complete lesson note to guide your studies.

JSS3 Lesson Note
The complete lesson note to guide your studies.