Everyday Statistics Basic 3 Mathematics Lesson Note
Download Lesson NoteTopic: Everyday Statistics
A. COUNTING SKILL: NUMBERS 981-1000
Counting from 981 to 1000: 981, 982, 983, 984, 985, 986, 987, 988, 989, 990, 991, 992, 993, 994, 995, 996, 997, 998, 999, 1000
Special milestone: 1000 = One thousand
Practice counting:
- From 985 to 995: _______
- From 992 to 1000: _______
- Backwards from 1000 to 990: _______
Fill in missing numbers:
- 986, 987, _____, 989, _____
- 995, _____, 997, _____, 999
- _____, 982, _____, 984, _____
B. WRITING SKILL: WRITING OF THE NUMBERS
Write in words:
- 981 = Nine hundred and eighty-one
- 985 = Nine hundred and eighty-five
- 990 = Nine hundred and ninety
- 995 = Nine hundred and ninety-five
- 1000 = One thousand
Write in figures:
- Nine hundred and eighty-three = _______
- Nine hundred and eighty-eight = _______
- Nine hundred and ninety-two = _______
- Nine hundred and ninety-seven = _______
- Nine hundred and ninety-nine = _______
C. READING AND INTERPRETATION OF GRAPHS
What is a graph? A graph is a picture that shows information using numbers and symbols.
Why do we use graphs?
- To show information clearly
- To compare numbers easily
- To see patterns and differences
Types of simple graphs:
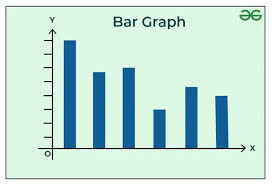
- Bar graphs – use bars of different heights
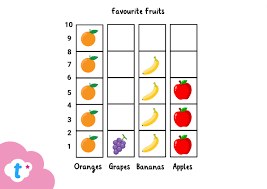
Pictograms – use pictures to represent numbers
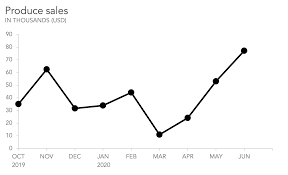
Line graphs – use lines to show changes
SIMPLE BAR GRAPH
Example: Favorite Fruits in Class 3A
Number of pupils
6 | ■
5 | ■
4 | ■ ■
3 | ■ ■
2 | ■ ■ ■
1 | ■ ■ ■
0 +—+—-+—-+—
Apple Orange Banana
Reading the bar graph:
- How many pupils like apples? _____
- How many pupils like oranges? _____
- How many pupils like bananas? _____
- Which fruit is most popular? _____
- Which fruit is least popular? _____
Practice reading: Look at this bar graph showing pets owned by pupils:
Number of pets
8 | ■
6 | ■
4 | ■ ■
2 | ■ ■ ■
0 +–+–+–+—
Cat Dog Bird
- How many cats are owned? _____
- How many dogs are owned? _____
- How many birds are owned? _____
- Which pet is most common? _____
D. PICTOGRAMS AND MODELS
What is a pictogram? A pictogram uses pictures or symbols to show information.
How to read a pictogram:
- Each picture represents a certain number
- Count the pictures to find the total
- Look at the key to understand what each picture means
PICTOGRAM EXAMPLE
Books Read by Each Class
Class 3A: 📖 📖 📖 📖
Class 3B: 📖 📖 📖
Class 3C: 📖 📖 📖 📖 📖
Key: 📖 = 5 books
Reading the pictogram:
- How many books did Class 3A read? 4 × 5 = _____ books
- How many books did Class 3B read? 3 × 5 = _____ books
- How many books did Class 3C read? 5 × 5 = _____ books
- Which class read the most books? _____
- How many books were read in total? _____
ANOTHER PICTOGRAM EXAMPLE
Ice Cream Sold Each Day
Monday: 🍦 🍦
Tuesday: 🍦 🍦 🍦 🍦
Wednesday: 🍦 🍦 🍦
Thursday: 🍦 🍦 🍦 🍦 🍦
Friday: 🍦 🍦 🍦 🍦 🍦 🍦
Key: 🍦 = 3 ice creams
Practice reading:
- How many ice creams were sold on Monday? _____
- How many ice creams were sold on Tuesday? _____
- How many ice creams were sold on Thursday? _____
- Which day had the highest sales? _____
- Which day had the lowest sales? _____
E. CREATING SIMPLE GRAPHS
How to make a pictogram:
- Collect the information
- Choose a symbol
- Decide what each symbol represents
- Draw the symbols for each group
- Write a key
Example data: Flowers in the school garden
- Roses: 10
- Sunflowers: 15
- Daisies: 5
Create a pictogram: If 🌹 = 5 flowers, draw the pictogram:
Roses: _____ (draw symbols) Sunflowers: _____ (draw symbols) Daisies: _____ (draw symbols)
Making a simple bar graph:
- Draw two lines (vertical and horizontal)
- Write numbers on the vertical line
- Write categories on the horizontal line
- Draw bars to show the amounts
F. QUANTITATIVE REASONING
Data collection and analysis:
- Survey problem: Class 3B asked pupils about their favorite colors:
- Red: 8 pupils
- Blue: 12 pupils
- Green: 6 pupils
- Yellow: 4 pupils
- a) Which color is most popular? _____ b) Which color is least popular? _____ c) How many more pupils like blue than red? _____
- Sports participation: Look at this pictogram of sports played: Football: ⚽ ⚽ ⚽ ⚽ Tennis: ⚽ ⚽ Swimming: ⚽ ⚽ ⚽ Key: ⚽ = 4 pupils a) How many pupils play football? _____ b) How many pupils play tennis? _____ c) What is the total number of pupils? _____
- Daily temperature: A bar graph shows temperatures: Monday: 25°C, Tuesday: 30°C, Wednesday: 28°C a) Which day was hottest? _____ b) Which day was coolest? _____ c) What is the difference between highest and lowest? _____
CLASS EXERCISES
- Count from 988 to 998:
- Write in words:
- 987 = _______
- 993 = _______
- 1000 = _______
- Write in figures:
- Nine hundred and eighty-nine = _______
- Nine hundred and ninety-six = _______
Read the bar graph about favorite subjects:
Number of pupils
10 | ■
8 | ■
6 | ■ ■
4 | ■ ■ ■
2 | ■ ■ ■
0 +–+–+–+—
- Math Eng Science
- How many like Math? _____
- How many like English? _____
- Which subject is most popular? _____
- Read the pictogram about transport to school: Walking: 👟 👟 👟 Bus: 👟 👟 👟 👟 👟 Car: 👟 👟 Key: 👟 = 6 pupils
- How many pupils walk? _____
- How many take the bus? _____
- What is the most common transport? _____
- Create a pictogram: Fruits sold: Apples 20, Oranges 15, Bananas 10 Use 🍎 = 5 fruits Apples: _____ Oranges: _____ Bananas: _____
- Interpret data: A graph shows rainfall in mm: January: 50mm, February: 30mm, March: 40mm
- Which month had most rain? _____
- Which month had least rain? _____
- Total rainfall for 3 months? _____
- Word problem: A shop sells drinks. Monday: 25 bottles, Tuesday: 35 bottles, Wednesday: 20 bottles
- Which day had highest sales? _____
- How many bottles sold in 3 days? _____
- True or False:
- Graphs help us see information clearly: _____
- Pictograms use only numbers: _____
- Bar graphs use bars of different heights: _____
- Problem solving: Design a simple survey about favorite school subjects for 5 friends. Collect data and create a pictogram showing your results.
Third Term Mathematics Lesson Notes for Other Topics
Squares And Rectangles
Explore lesson notes covering all topics.

Time
Explore lesson notes covering all topics.

Weight
Explore lesson notes covering all topics.

Capacity
Explore lesson notes covering all topics.

Line Of Symmetry
Explore lesson notes covering all topics.

Length: Measurement in Centimetre & Metres
Explore lesson notes covering all topics.

Perimeter of Rectangle, Square & Triangles
Explore lesson notes covering all topics.
Data Collection
Explore lesson notes covering all topics.
Three-Dimensional Shapes
Explore lesson notes covering all topics.

Money
Explore lesson notes covering all topics.
Capacity
Explore lesson notes covering all topics.
Weight
Explore lesson notes covering all topics.
Length Measurement
Explore lesson notes covering all topics.

Area
Explore lesson notes covering all topics.
Two-Dimensional Shapes
Explore lesson notes covering all topics.
Lesson Notes for Other Classes

Basic 2 Lesson Note
The complete lesson note to guide your studies.

Basic 4 Lesson Note
The complete lesson note to guide your studies.
Basic 5 Lesson Note
The complete lesson note to guide your studies.
JSS1 Lesson Note
The complete lesson note to guide your studies.
JSS2 Lesson Note
The complete lesson note to guide your studies.

JSS3 Lesson Note
The complete lesson note to guide your studies.