Graph Of Linear Inequality In Two Variables SS2 Mathematics Lesson Note
Download Lesson NoteTopic: Graph Of Linear Inequality In Two Variables
The term inequality applies to any statement involving one of the symbols. Similar to ordinary equations, inequality equations too have solutions.
RULES FOR FINDING THE SOLUTIONS TO INEQUALITY EQUATIONS
- Add or subtract the same expression or number to both sides of the inequality and preserve the inequality sign.
- Multiply or divide both sides of the inequality by the same positive number and preserve the inequality sign.
- Multiply or divide both sides of the inequality by the same negative number and reverse the inequality sign.
The expression 3x – 1 > x + 1 is a linear inequality in one variable x. Thus, a linear inequality in x is an inequality in which the highest power of x is one (unity).
Solve the following linear inequality and represent them on a number line.
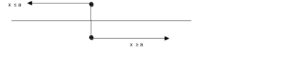
A number line is used to illustrate linear inequalities in one variable. A point x = a divides the number line into 2 parts, x < a and x > a
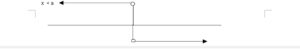
But when x = a is included, the number line becomes
A line segment from a to be is denoted by a and it is shown below
![]()
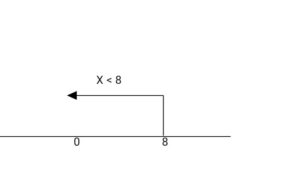
i. 4x + 8 < 3x + 16
Subtract 8 from both sides
4x + 8 – 8 < 3x – 8 + 16
4x < 3x + 8
Subtract 3x from both sides
4x – 3x < 3x + 8 – 3x
X < + 8
ii. 3 (x – 6) 9 (x – 1)
open the brackets
3x – 18 9x – 9
Collect like terms
3x – 9x -9 + 18
-6x + 9
Divide through by -6 and change the sign.
-6 > -9
6 6
X > -3
2
(x > 2³/⁷)

Third Term Mathematics Lesson Notes for Other Topics

Longitude and Latitude II
Explore lesson notes covering all topics.

Bearings
Explore lesson notes covering all topics.
Probability
Explore lesson notes covering all topics.

Application Of Linear Inequality In Real Life
Explore lesson notes covering all topics.

Statistics
Explore lesson notes covering all topics.

Probability
Explore lesson notes covering all topics.

Graphical Presentation of Data & Frequency Distribution
Explore lesson notes covering all topics.

Collection, Tabulation & Presentation of Grouped Data
Explore lesson notes covering all topics.

Area And Volume Of Frustum
Explore lesson notes covering all topics.

Surface Area And Volume Of Solid Shapes
Explore lesson notes covering all topics.

Area Of Sector And Segment
Explore lesson notes covering all topics.

Mensuration: Circle and It's Properties
Explore lesson notes covering all topics.
Statistics -Data Representation (Bar Chart And Pie Charts)
Explore lesson notes covering all topics.

Angles of Elevation And Depression
Explore lesson notes covering all topics.
Angles And Polygons
Explore lesson notes covering all topics.


Lesson Notes for Other Classes

JSS1 Lesson Note
The complete lesson note to guide your studies.

JSS2 Lesson Note
The complete lesson note to guide your studies.

SS1 Lesson Note
The complete lesson note to guide your studies.

SS3 Lesson Note
The complete lesson note to guide your studies.