Production Possibility Curve SS2 Economics Lesson Note
Download Lesson NoteTopic: Production Possibility Curve
A production possibility curve (PPC) is a graphical or diagrammatic illustration of all possible bundles or combinations of two types of goods which a society can produce using its present level of resources and given the existing level of technology.
The idea behind the production possibility curve is that to produce a particular commodity, the production of another commodity has to be sacrificed.
For example, the production possibility curves for the production of cattle and motor vehicles in South Africa.
Production Possibility Table for The Production of Cattle and Motor Vehicles by South Africa.
| POSSIBLE COMBINATION | HEAD OF CATTLE | NOS. OF MOTOR VEHICLES |
| A | 200 | 0 |
| B | 170 | 30 |
| C | 100 | 70 |
| D | 80 | 130 |
| E | 40 | 150 |
| F | 0 | 180 |
The table shows the alternative open to South Africa to substitute the production of cattle for vehicles every month, assuming a given state of technology and a given total of resources.

Production Possibility Curve for the Production of Cattle and Motor Vehicles in South Africa.
INTERPRETATION OR POINTS TO NOTE FROM THE GRAPH
- Points A to F on the graph indicate efficient use of resources.
- At points O and P (outside the curve), production is not feasible. Production of these points is not feasible due to the limited resources and technology.
- At points K and L (inside the curve), production is feasible. It represents where resources are not efficiently utilized.
- The downward slope of the PPC indicates that there is an opportunity cost of producing more of one type of commodity and less of the other due to limited resources and technical know-how
LAW OF DIMINISHING RETURNS OR VARIABLE PROPORTION
This law refers to a short-run production situation. The law of diminishing returns states that as more of the variable factor (e.g. labour or capital) is added to other factors which are constant (e.g. land), outputs will eventually increase at a decreasing rate.
The law of diminishing returns follows three stages, these are;
- Increasing returns
- Constant returns
- Decreasing returns
CONCEPT OF TOTAL, AVERAGE AND MARGINAL UTILITY
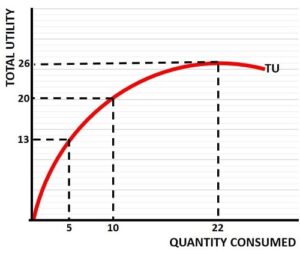
- Total Utility: This is the total amount of satisfaction a consumer derives from the consumption of a particular commodity at a point in time. Consumers’ utility increases as the quantity consumed increases but not at an equal rate because consumers have a saturation point in the consumption of a particular commodity at a given time.
- Average Utility: This is derived by dividing total utility by the units of the commodity consumed. That is, it is the satisfaction that a consumer derives per unit of a commodity consumed.
AU = TU/Q
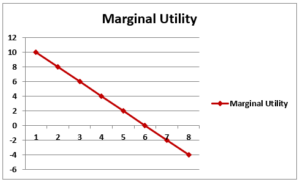
- Marginal Utility: This means the additional satisfaction a consumer derives from the consumption of additional units of a particular commodity. It is then the change in the total utility as a result of the consumption of additional units of a commodity. MU = ∆TU/∆Q
RELATIONSHIP BETWEEN TOTAL PRODUCT, AVERAGE PRODUCT AND MARGINAL PRODUCT.
The relationship between total products, average product and marginal product can be demonstrated by a graph. Both TP and MP initially rise. The TP curve remains at the maximum point when MP is zero. To declines after MP = 0 and MP afterwards assumes negative values.

Second Term Economics Lesson Notes for Other Topics

Economic Growth and Development
Explore lesson notes covering all topics.

Balance of Payments (B.O.P) 2
Explore lesson notes covering all topics.

Balance of Payments (B.O.P) 1
Explore lesson notes covering all topics.

Economic Reform Programmes
Explore lesson notes covering all topics.

Economic Development Challenges
Explore lesson notes covering all topics.

Current Economic Plans MDGs NEEDS Vision 2030
Explore lesson notes covering all topics.

International Economic Organization
Explore lesson notes covering all topics.

Economic Development Planning
Explore lesson notes covering all topics.

Imperfect Market
Explore lesson notes covering all topics.

Industries In Nigeria
Explore lesson notes covering all topics.

Market Structure
Explore lesson notes covering all topics.

Supply And Demand Of Labour
Explore lesson notes covering all topics.

Labour Market
Explore lesson notes covering all topics.

Economics System
Explore lesson notes covering all topics.

Cost Concept
Explore lesson notes covering all topics.


Lesson Notes for Other Classes

JSS1 Lesson Note
The complete lesson note to guide your studies.

JSS2 Lesson Note
The complete lesson note to guide your studies.

SS1 Lesson Note
The complete lesson note to guide your studies.

SS3 Lesson Note
The complete lesson note to guide your studies.