Basic Tools Of Economic Analysis SS1 Economics Lesson Note
Download Lesson NoteTopic: Basic Tools Of Economic Analysis
- TABLES OR SCHEDULES
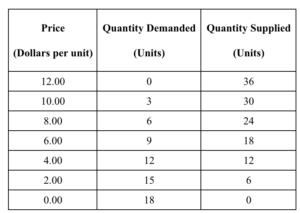
A table is a systematic and orderly arrangement of information, facts or data, using rows and columns for presentation which makes it easier for a better understanding of the relationship between variables. It serves as the most commonly used tool in Economics for economic analysis. Below is an example of a table.
FEATURES OF A TABLE
- It must give an orderly arrangement of data.
- It must have a title or heading.
- It must be numbered if there are many.
- It must be very simple and easy to understand.
- The units of measurement used in the table must be stated.
USES OR IMPORTANCE OF A TABLE
- It reveals information at a glance.
- It avoids repetition.
- It makes data easy to understand.
- It allows for easy interpretation of data.
- It eases comparison between classes of data.
- GRAPHS
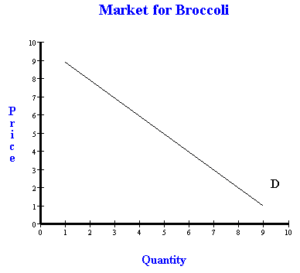
A graph is a diagram showing a functional relationship between two variables. Information presented in the table can be translated into a graph for better understanding. Many types of graphs are used for economic analysis depending on the nature of the data and the purpose for which they are intended
FEATURES OF A GRAPH
- It must be titled.
- It must possess appropriate scales.
- The y and x axes must carry different variables.
- It must show the source of data presented.
- The y-axis must be on the vertical side and the x-axis on the horizontal side.
- It must be well-labelled for better understanding.
IMPORTANCE OF A GRAPH
- It shows the relationship between two variables.
- It makes quantitative information illustrated in tabular form a clearer and quicker impression.
- It helps to interpret the values of variables.
- The values or quantities in the table are better understood and appreciated in the graph.
- It provides a basis for comparing variables provided in the table.
- CHARTS
A Chart is a device being used to provide us with the interpretation or presentation of data in the form of a diagram or picture. In economics, many types of charts are used for economic analysis among which are bar charts and pie charts.
- BAR CHART
A bar chart is a way of representing tabulated data with evenly spaced bars with equal gaps. Bar charts can be of three types:
- Simple bar charts: Used for data with one variable
- Component bar charts: Used for data with two variables
- Multiple bar charts: Used for data with more than two.
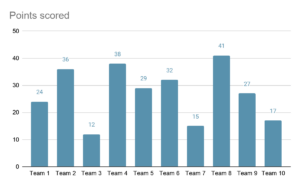
Diagram of a typical bar chart
b. Pie Charts
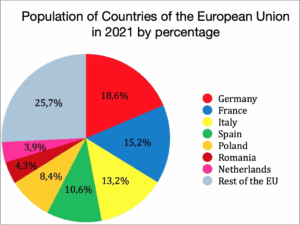
This is a circle divided into sections expressed in degrees with each section proportionate to the frequency or attribute. The circle represents the total data and with the use of a compass and protractor, it is drawn.
First Term Economics Lesson Notes for Other Topics

Price Control
Explore lesson notes covering all topics.

Rationing And Hoarding
Explore lesson notes covering all topics.
Basic Tools For Economic Analysis
Explore lesson notes covering all topics.

Measures Of Dispersion
Explore lesson notes covering all topics.

Theory Of Consumer Behaviour
Explore lesson notes covering all topics.

Demand And Supply
Explore lesson notes covering all topics.
Elasticity Of Demand
Explore lesson notes covering all topics.
Income Elasticity Of Demand
Explore lesson notes covering all topics.

Cross Elasticity Of Demand
Explore lesson notes covering all topics.
Scale Of Production
Explore lesson notes covering all topics.
Division Of Labour And Specialization
Explore lesson notes covering all topics.

Theory Of Production II
Explore lesson notes covering all topics.
Theory of Production
Explore lesson notes covering all topics.

Concept Of Demand And Supply II
Explore lesson notes covering all topics.

Concept Of Demand And Supply
Explore lesson notes covering all topics.


Lesson Notes for Other Classes

Basic 2 Lesson Note
The complete lesson note to guide your studies.
Basic 3 Lesson Note
The complete lesson note to guide your studies.

Basic 4 Lesson Note
The complete lesson note to guide your studies.

Basic 5 Lesson Note
The complete lesson note to guide your studies.

JSS1 Lesson Note
The complete lesson note to guide your studies.

JSS2 Lesson Note
The complete lesson note to guide your studies.